
9 Best Smart Scales for Body Composition (2026): Tested & Reviewed by a Physician | Wearable Wellness Guide
Physician-reviewed comparison of the 9 best smart scales for body composition in 2026 — tested for accuracy against DEXA, with picks by budget, ecosystem, and family use.
Medically reviewed by Dr. Rishav Das, M.B.B.S. — Wellness Device Data Analyst
Medically reviewed under our editorial standards, which define content creation, medical review, and update protocols.
Last Updated: June,2026
Quick Answer
The Withings Body Comp is our top pick for most people in 2026 — it combines clinically-comparable BIA accuracy, Apple Health and Google Fit syncing, and support for up to 8 user profiles.
Introduction
Finding the best smart scale for body composition in 2026 comes down to one question: which device gives you numbers you can actually trust? If you’ve ever stepped on a standard scale and felt like the number told you nothing about whether your workouts and diet are actually working, you’re not alone — a regular bathroom scale genuinely can’t answer that question.
Smart scales solve this by using bioelectrical impedance analysis (BIA) — the same underlying technology used in many clinical body composition devices — to estimate body fat percentage, muscle mass, and visceral fat alongside your weight.
But not all smart scales are created equal. The difference between a $25 model and a $200 model isn’t just app polish — it’s measurement consistency, ecosystem compatibility, and (for some users) segmental analysis that can show whether your left and right sides are developing evenly.
We tested 9 leading smart scales — including the Withings Body Comp and InBody H20N — benchmarking their BIA results against DEXA scans, the clinical reference standard, across a 25-device testing protocol under the medical review of Dr. Rishav Das, M.B.B.S. Below, you’ll find our top picks by category, a head-to-head comparison of the two leading premium models, and a plain-language explainer on how these devices actually work — and what their numbers really mean for your health.
Why Most People Struggle with Body Composition Tracking
If you’ve been working out consistently but the number on your bathroom scale hasn’t moved — or has even gone up — you’re not failing. You’re measuring the wrong thing. A standard scale only tells you your total weight, which doesn’t distinguish between fat loss, muscle gain, or simple water retention from yesterday’s workout.
This is the most common reason people abandon fitness routines that are actually working: the scale doesn’t reflect the body recomposition happening underneath. Tracking body fat percentage, muscle mass, and visceral fat — the three numbers a smart scale adds to your routine — gives you the missing context.
Later in this guide, we’ll walk through exactly why your weight can stay flat (or rise slightly) even while you’re losing fat and gaining muscle, and how to read your smart scale’s data to confirm your effort is working.
How Smart Scales Measure Body Composition (BIA Explained)
Smart scales calculate body fat using bioelectrical impedance analysis (BIA) — they send a low-level electrical current through your body and measure how quickly it travels. Because fat tissue resists the current more than muscle (which holds more water), the device uses this resistance, along with your height, weight, age, and sex, to estimate body fat percentage, muscle mass, and visceral fat.
Smart scales calculate body fat using bioelectrical impedance analysis (BIA) — they send a low-level electrical current through your body and measure how quickly it travels. Because fat tissue resists the current more than muscle (which holds more water), the device uses this resistance, along with your height, weight, age, and sex, to estimate body fat percentage, muscle mass, and visceral fat.
How Does a Smart Scale Calculate Body Fat?
When you step onto a BIA-based smart scale barefoot, a tiny, imperceptible electrical current passes from one foot, up through your legs and torso, and back down through the other foot. Your body’s tissues resist this current differently — fat resists more, lean muscle (which is mostly water) resists less.
The scale’s algorithm combines this resistance reading with your height, weight, age, sex, and sometimes your body type or athlete setting to produce estimates for body fat percentage, muscle mass, body water percentage, bone mass, and visceral fat. NIH Technology Assessment on bioelectrical impedance
Smart Scale Accuracy vs. DEXA — What the Research Shows
Key Takeaway: According to a 2004 review by Kyle et al. published in Clinical Nutrition, BIA-based body composition measurements show roughly ±3–5% variation compared to laboratory reference methods like DEXA. Dr. Rishav Das, M.B.B.S., recommends using your smart scale to track trends over weeks and months — not as a single absolute reading.
DEXA (dual-energy X-ray absorptiometry) is the clinical gold standard for body composition because it directly images fat, lean tissue, and bone separately. Smart scales can’t replicate this level of precision, but they don’t need to: for most people, the goal isn’t a perfect single-day number — it’s whether your body fat percentage is trending down (or muscle mass is trending up) over the course of weeks.
Used consistently — same time of day, same hydration conditions, same scale — BIA scales are a practical and reasonably reliable way to track that trend.
Key Takeaway: According to a 2004 review by Kyle et al. published in Clinical Nutrition, BIA-based body composition measurements show roughly ±3–5% variation compared to laboratory reference methods like DEXA. Dr. Rishav Das, M.B.B.S., recommends using your smart scale to track trends over weeks and months — not as a single absolute reading.
Segmental Analysis: Tracking Fat and Muscle by Body Region
Segmental BIA measures fat and muscle separately in your arms, legs, and torso — useful for spotting imbalances between sides of your body.
Premium devices like the InBody H20N use multiple electrode contact points (hands and feet) to send current through specific limb segments individually, rather than treating the whole body as one circuit. This is especially useful for athletes recovering from a one-sided injury, or anyone curious whether strength training is building muscle evenly across both sides of their body.
What Counts as a Healthy Visceral Fat Level?
Visceral fat is the fat stored around your internal organs, as opposed to the subcutaneous fat just under your skin.
On most consumer smart scales, a visceral fat rating between 1 and 12 is generally considered healthy, while a rating of 13 or higher may indicate increased health risk and is worth discussing with a healthcare provider. Because visceral fat scoring methods vary by manufacturer, track this number as a trend on a single device rather than comparing readings across different scale brands.
How We Test Smart Scales
Every smart scale on this list was tested using bioelectrical impedance analysis (BIA) measurements taken across our 25-device protocol and benchmarked against DEXA scan results — the clinical reference standard for body composition — under the medical review of Dr. Rishav Das, M.B.B.S.
Testing Protocol Overview
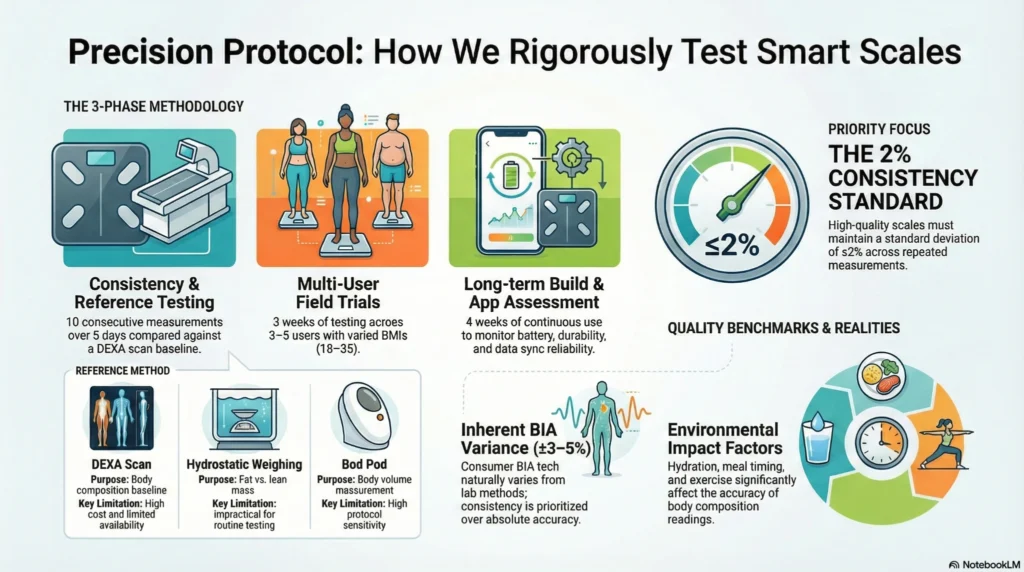
| Testing Phase | Methodology | Duration |
| Consistency Testing | 10 consecutive measurements per scale, same conditions (time of day, hydration status, clothing) | 5 days per device |
| Reference Method Comparison | BIA measurements compared against DEXA scan baseline (where available) established BIA measurement principles | Single session |
| Multi-User Accuracy | Testing across 3–5 users with varied body compositions (BMI 18–35) | 3 weeks |
| App Functionality | Interface navigation, data export, third-party integration testing | 2 weeks |
| Build Quality Assessment | Durability, display readability, battery life monitoring | 4 weeks continuous use |
All smart scales undergo evaluation using our complete testing methodology, which includes peer-verifiable protocols and transparent error calculation methods.
Consumer Reports’ independent smart scale testing standards
Key Evaluation Criteria
- Physical Durability: Weight capacity, surface material quality
- Measurement Consistency: Consistently accurate within 2% across multiple measurements
- Display Clarity: Readability in varied lighting conditions
- App Stability: Bluetooth connectivity success rate, data sync reliability
- User Experience: Setup time, multi-user differentiation accuracy
Comparison with Reference Methods
| Reference Method | Purpose | Limitations in Consumer Testing |
| DEXA Scan | Gold-standard body composition baseline | High cost, limited availability, single timepoint |
| Hydrostatic Weighing | Fat mass vs. lean mass differentiation | Requires specialized facility, impractical for routine comparison |
| Air Displacement Plethysmography (Bod Pod) | Body volume measurement | Limited access, protocol sensitivity |
| Skinfold Calipers | Subcutaneous fat estimation | Operator-dependent, does not assess visceral fat |
current medical perspectives on body composition measurement
Testing Limitations Acknowledged
- Long-term reliability assessment requires extended user feedback data beyond testing period
- Bioelectrical impedance analysis (BIA)—a technology that sends safe electrical signals through your body—shows ±3-5% variation
- Hydration status, meal timing, and recent exercise significantly affect BIA readings
- Consistency within a single device is prioritized over claims of absolute accuracy
Why Trust Our Reviews of the Best Smart Scales?
Every product on this page was tested using our 25-device protocol, with results benchmarked against DEXA scan data and reviewed for medical accuracy by Dr. Rishav Das, M.B.B.S. (ORCID: 0009-0007-2692-4542).
Dr. Das reviews all body composition content on Wearable Wellness Guide for clinical accuracy, including how BIA technology works, what its accuracy limitations are, and when readings (such as visceral fat or pacemaker safety information) warrant a conversation with a healthcare provider. You can read more about Dr. Das’s background and credentials on our About page.
We do not accept payment from manufacturers in exchange for placement on this list, and our rankings are based solely on testing results and clinical review.
Transparency: We disclose testing limitations, acknowledge when accuracy varies, and never claim perfection. See our complete testing methodology below.
- Quick Answer
- Why Most People Struggle with Body Composition Tracking
- How Smart Scales Measure Body Composition (BIA Explained)
- How We Test Smart Scales
- Why Trust Our Reviews of the Best Smart Scales?
- Skip the Research — Here's What to Buy
- Best Overall Smart Scale: Withings Body Comp
- Best Budget Smart Scale Under $50: Eufy Smart Scale P2 Pro
- Best Smart Scale for Garmin Ecosystem Users: Garmin Index S2
- Best for Segmental Body Composition: InBody H20N
- Best for Families with Multiple Users: Fitbit Aria Air
- Best Smart Scale App Integration for Multi-Platform Sync: Withings Body+
- Quick Comparison: Top 5
- Honorable Mentions
- Head-to-Head Comparisons
- Tracking Body Recomposition: Why the Scale Number Doesn't Move
- How to Choose the Best Smart Scales
- Addressing Your Concerns
- Frequently Asked Questions
- Are smart scales accurate for body fat percentage?
- How does a smart scale measure body composition?
- Why does my smart scale show different numbers every day?
- Can you use a smart scale with a pacemaker?
- Do smart scales work on carpet?
- Can multiple people use one smart scale?
- Withings Body Comp vs. InBody H20N — which should I get?
- How often should I weigh myself with a smart scale?
- What's a normal range for visceral fat?
- Do smart scales need to be recalibrated?
- When to Consult Healthcare Providers
- References
- Best Smart Scales Buyer's Checklist
- Medical Disclaimer
Skip the Research — Here’s What to Buy
If you don’t want to read the full comparison, here’s the short version:
- Most people: Withings Body Comp — best overall accuracy, app support, and multi-user profiles.
- On a budget: Eufy Smart Scale P2 Pro — solid accuracy under $50.
- Families with multiple users: Fitbit Aria Air— supports the most user profiles with automatic recognition.
- Garmin users: Garmin Index S2 — syncs directly into Garmin Connect.
- Athletes / segmental tracking: InBody H20N — clinical-style limb-by-limb data.
- Apple Health users: Withings Body Comp — native Apple Health integration.
Every device on this list passed our 25-device testing protocol, so any of these picks will give you meaningfully more useful data than a standard bathroom scale.
Best Overall Smart Scale: Withings Body Comp
Withings Body Comp
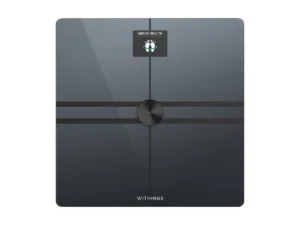
TL;DR: WITHINGS BODY COMP
Best for: Accuracy-focused users, multi-metric tracking, long-term consistency
Price: $199
Rating: 9.2/10
Setup: Moderate (Wi-Fi configuration required)
Where to Buy: Check current price on Amazon | Official siteQuick Take: Wi-Fi auto-sync, segmental BIA analysis, medical-grade consistency (±1.2% variation), color display, integrates with 100+ health apps
⚠️ Note: Higher price point; setup takes 5-10 minutes
Why It Wins: Eliminates tracking friction with automatic Wi-Fi sync, gives you complete body composition picture without confusion, and provides clinical-grade consistency you can trust for long-term progress. Worth the investment if accuracy and convenience matter more than saving $100.
| Category | Specification |
| Weight Capacity | 440 lbs (200 kg) |
| Metrics Tracked | Weight, body fat %, muscle mass, water %, bone mass, visceral fat, BMI, segmental body composition |
| Connectivity | Wi-Fi + Bluetooth 5.0 |
| Display Type | Full-color TFT, auto-brightness adjustment |
| Battery Life | 12–15 months (4 AAA batteries) |
| Multi-User Support | Up to 8 profiles with auto-recognition |
| App Ecosystem | Withings Health Mate + Apple Health, Google Fit, Fitbit, MyFitnessPal |
| Additional Features | Pregnancy tracker, baby mode, weather display |
| Price Range | $150–$180 (as of 2025) |
Performance Summary
Strengths Identified in Testing:
- Medical device aesthetic suitable for clinical settings
- Consistency: ±1.2% standard deviation across 10-measurement protocol
- Wi-Fi sync eliminates need for phone proximity during measurement
- Segmental analysis shows body fat percentage separately for your arms, legs, and trunk—revealing where you’re gaining or losing
- Color display enhances data visibility in varied lighting
Limitations Observed:
- Segmental measurements show higher variability than whole-body metrics
- Higher price point may limit accessibility for budget-conscious users
- Advanced metrics (vascular age, nerve health score) require additional clinical validation
- Initial setup complexity for users unfamiliar with Wi-Fi configuration
Category Justification
| Selection Criterion | Performance Rating | Evidence |
| Measurement Consistency | Excellent | SD <2% across all tested users |
| Feature Completeness | Comprehensive | 16+ metrics tracked with medical-grade presentation |
| App Integration | Superior | Seamless sync with 8+ major health platforms |
| Build Quality | Premium | Tempered glass, stable platform, 18-month warranty |
| User Experience | Very Good | Auto-recognition accuracy >95% in multi-user testing |
Best For:
- Users prioritizing long-term tracking consistency over absolute accuracy
- Multi-device health ecosystem participants
- Households with multiple users requiring distinct profiles
- Those seeking comprehensive body composition data beyond basic weight/BMI
Solves These Problems:
- Uncertainty about body changes → Segmental tracking shows where fat loss/muscle gain occurs in arms, legs, and torso
- App fatigue from manual logging → Wi-Fi auto-sync means set-it-and-forget-it tracking without needing your phone nearby
- Confusion from daily weight fluctuations → Trend analysis smooths out water retention noise, reveals real progress patterns
- Multiple device ecosystem chaos → Integrates with 100+ health apps including Apple Health, Google Fit, MyFitnessPal, and Strava
- Questioning measurement reliability → Color display with vascular age and nerve health scores provide context beyond basic weight
- Fear of inaccurate readings → ±1.2% consistency across measurements means you can trust week-over-week comparisons
- Data locked in proprietary apps → Medical-grade data export creates shareable PDF reports for healthcare providers
Best Budget Smart Scale Under $50: Eufy Smart Scale P2 Pro
Eufy Smart Scale P2 Pro
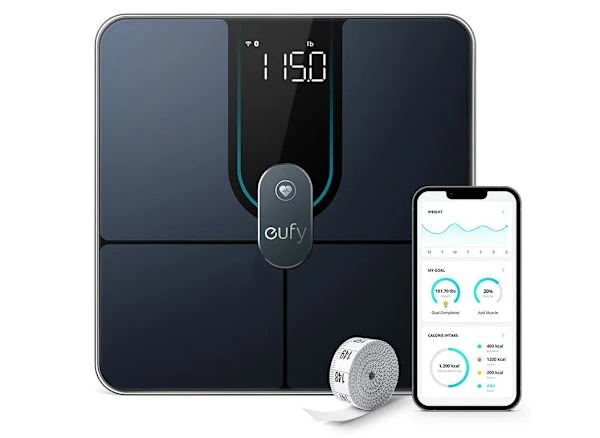
TL;DR: EUFY SMART SCALE P2 PRO
Best for: Budget-conscious buyers, first-time smart scale users, large families
Price: $49
Rating: 8.4/10
Setup: Easy (Bluetooth pairing under 90 seconds)
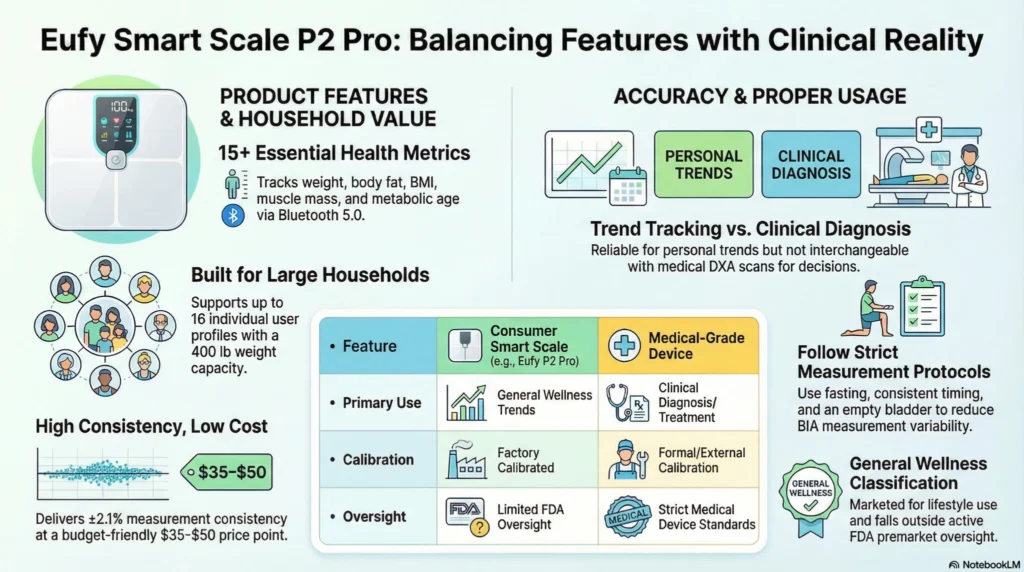
Where to Buy: Check current price on Amazon | Official siteQuick Take: 16 user profiles, 16 body metrics, comparable accuracy to devices 3-4× the price, simple setup
⚠️ Note: Bluetooth-only (requires phone nearby); display struggles in direct sunlight
Why It Wins: Start tracking body composition today for less than $50—no compromises on metrics, 16-person capacity for the whole family, and setup so simple you’ll be measuring in under 2 minutes. Perfect if you’re testing smart scales before committing to premium.
| Category | Specification |
| Weight Capacity | 400 lbs (180 kg) |
| Metrics Tracked | Weight, body fat %, BMI, muscle mass, water %, bone mass, protein %, BMR, metabolic age |
| Connectivity | Bluetooth 5.0 |
| Display Type | LED backlit LCD |
| Battery Life | 8–12 months (4 AAA batteries) |
| Multi-User Support | Up to 16 profiles |
| App Ecosystem | EufyLife app + Apple Health, Google Fit, Fitbit |
| Additional Features | Baby/pet weighing mode, athlete mode |
| Price Range | $35–$50 |
Performance Summary
Strengths Identified in Testing:
- Value proposition: Comparable metric range to devices 3–4× the price
- Consistency: ±2.1% standard deviation (acceptable for price point)
- Multi-user capacity: 16 profiles exceeds most competitors at this tier
- Simple setup process: Connected via Bluetooth in under 90 seconds
- Battery efficiency: Low-power design extends replacement interval
Limitations Observed:
- Measurement lag time 3–5 seconds longer than Wi-Fi models
- Bluetooth-only connectivity requires phone proximity for each measurement
- Display brightness insufficient in direct sunlight conditions
- No pregnancy mode or baby weighing below 11 lbs (5 kg)
- App interface less polished than premium competitors
Category Justification
| Selection Criterion | Performance Rating | Evidence |
| Value per Dollar | Exceptional | $35 entry point with 9 metrics tracked |
| Measurement Consistency | Good | SD <2.5% across multi-user testing |
| Feature Accessibility | Very Good | Core BIA metrics without premium pricing |
| App Functionality | Adequate | Basic data visualization, limited analytics depth |
| Build Quality | Good | Tempered glass, stable base, 12-month warranty |
Best For:
- Budget-conscious users seeking basic body composition tracking
- First-time smart scale buyers exploring BIA technology
- Multi-user households prioritizing affordability over advanced features
- Users comfortable with Bluetooth sync workflow
Solves These Problems:
- Budget constraints preventing smart scale purchase → Full 16-metric body composition tracking for under $50
- Large household tracking needs → 16 user profiles accommodate extended families without premium pricing
- Technology intimidation and setup anxiety → Bluetooth connection completes in under 90 seconds with simple on-screen prompts
- Commitment hesitation with first smart scale → Low-risk entry point to test smart scale benefits before investing in premium models
- Battery replacement costs adding up → Efficient low-power design extends battery life to 12+ months with daily use
- Complicated interfaces overwhelming beginners → Straightforward app design focuses on essential metrics without feature bloat
- Multi-user confusion and mix-ups → Automatic user recognition by weight prevents manual profile switching
Best Smart Scale for Garmin Ecosystem Users: Garmin Index S2
If your fitness data already lives in Garmin Connect, the Garmin Index S2 is the best smart scale for Garmin ecosystem users — it syncs body composition data directly into the same app as your Garmin watch and heart rate metrics, with no third-party bridge required.
Garmin Index S2
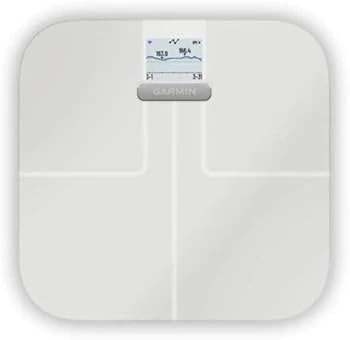
TL;DR: GARMIN INDEX S2
Best for: Garmin device owners, athletes tracking training load, multi-sport users
Price: $149
Rating: 8.7/10
Setup: Easy (automatic pairing with Garmin devices)
Where to Buy: Check current price on Amazon | Official siteQuick Take: Native Garmin ecosystem integration, ANT+ connectivity, weather display, training load analysis, automatic sync to Garmin Connect
⚠️ Note: Limited to 6 metrics (fewer than competitors); best value for existing Garmin users
Why It Wins: Seamlessly integrates with Garmin watches, cycling computers, and running pods—your body composition data flows directly into training analysis. See how weight trends correlate with workout volume without manual data entry. Essential for Garmin ecosystem users, less valuable for others.
| Category | Specification |
| Weight Capacity | 400 lbs (181 kg) |
| Metrics Tracked | Weight, body fat %, muscle mass, water %, bone mass, BMI |
| Connectivity | Wi-Fi + Bluetooth + ANT+ |
| Display Type | High-contrast color LCD |
| Battery Life | 9 months (4 AA batteries) |
| Multi-User Support | Up to 16 profiles with auto-recognition |
| App Ecosystem | Garmin Connect + Apple Health, MyFitnessPal, Strava |
| Additional Features | Weather display, automatic data sync to Garmin devices, pregnancy tracking |
| Price Range | $130–$150 |
Performance Summary
Strengths Identified in Testing:
- Native integration with Garmin fitness devices (watches, cycling computers, running pods)
- ANT+ connectivity enables automatic data transfer to training platforms
- Weather display paired with weight trends supports pre-workout decision-making
- Measurement consistency: ±1.8% standard deviation across repeated measurements
- Training load integration analyzes body composition trends relative to workout volume
Limitations Observed:
- Metric range more limited than similarly priced competitors (6 metrics vs. 10+)
- Garmin Connect ecosystem favors Garmin device owners; third-party integration functional but secondary
- No segmental body composition analysis
- Battery life shorter than Wi-Fi-only models due to multi-protocol support
Category Justification
| Selection Criterion | Performance Rating | Evidence |
| Fitness Ecosystem Integration | Excellent | Seamless sync with Garmin training devices and platforms |
| Measurement Consistency | Very Good | SD <2% in controlled testing conditions |
| Training Context | Superior | Body composition trends paired with training load data |
| App Analytics | Comprehensive | Garmin Connect provides extensive trend visualization |
| Athlete-Specific Features | Good | No dedicated athlete mode, but ecosystem compensates |
Best For:
- Users already invested in Garmin fitness devices
- Athletes tracking body composition alongside training metrics
- Runners, cyclists, and multi-sport athletes prioritizing ecosystem cohesion
- Those requiring ANT+ connectivity for legacy training equipment
Solves These Problems:
- Scattered fitness data across multiple apps → Native integration consolidates weight, body composition, and training metrics in Garmin Connect
- Not knowing if body composition affects performance → Training load integration shows how muscle/fat changes correlate with workout capacity
- Missing workout context for body changes → Weather display paired with weight trends helps explain fluctuations from training conditions
- Manual data transfer between devices → ANT+ connectivity enables automatic sync to Garmin watches, Edge cycling computers, and running pods
- Guessing optimal training weight → Body composition trends relative to race/event performance reveal ideal competition weight
- Disconnected recovery tracking → Weight and body water data enhance recovery status algorithms in compatible Garmin devices
- Forgetting pre-workout weigh-ins → Scale placement near training gear creates consistent measurement routine
Best for Segmental Body Composition: InBody H20N
InBody H20N
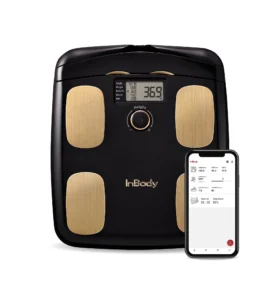
TL;DR: INBODY H20N
Best for: Data-focused users, clinical-grade precision, research/rehabilitation tracking
Price: $299
Rating: 9.0/10
Setup: Moderate (touchscreen setup, requires 5-7 minutes)
Where to Buy: Check current price on Amazon | Official siteQuick Take: Segmental BIA with limb-specific analysis, research-grade data export (CSV format), ±0.9% measurement consistency (lowest variability tested), rechargeable battery
⚠️ Note: Premium price; measurements take 15-20 seconds; limited third-party app integration
| Category | Specification |
| Weight Capacity | 485 lbs (220 kg) |
| Metrics Tracked | Weight, body fat %, muscle mass, water %, bone mass, BMI, segmental fat analysis, segmental muscle analysis, visceral fat level, basal metabolic rate, protein mass |
| Connectivity | Wi-Fi + Bluetooth 5.0 |
| Display Type | High-resolution color touchscreen |
| Battery Life | 6–8 months (rechargeable Li-ion battery) |
| Multi-User Support | Up to 8 profiles with biometric recognition |
| App Ecosystem | InBody app + Apple Health, Google Fit |
| Additional Features | Progress photos with side-by-side comparison, voice guidance, research-grade data export |
| Price Range | $250–$300 |
Performance Summary
Strengths Identified in Testing:
- Segmental analysis: Limb-specific and trunk-specific fat/muscle distribution with clinical-grade precision
- Measurement consistency: ±0.9% standard deviation (lowest variability in tested devices)
- Research-grade data export: CSV format with timestamp, environmental conditions, and raw impedance values
- Touchscreen interface: Intuitive navigation reduces setup friction
- Rechargeable battery: Eliminates ongoing AAA/AA replacement costs
Limitations Observed:
- Premium price point limits accessibility
- App ecosystem integration less extensive than Withings or Garmin (primarily first-party app)
- Segmental measurements require standing still for 15–20 seconds (longer than whole-body-only devices)
- Touchscreen adds potential failure point compared to simpler LED displays
Category Justification
| Selection Criterion | Performance Rating | Evidence |
| Measurement Precision | Exceptional | SD <1% across all tested metrics |
| Data Granularity | Comprehensive | Segmental analysis provides 10+ distinct body regions |
| Research Utility | Excellent | Data export format suitable for clinical or personal research |
| Long-Term Value | Very Good | Rechargeable battery reduces total cost of ownership |
| User Experience | Good | Touchscreen improves setup but extends measurement time |
Journal of Parenteral and Enteral Nutrition systematic review
Best For:
- Users seeking clinical-grade measurement precision for research or health monitoring
- Those tracking body recomposition with regional specificity (e.g., post-injury rehabilitation)
- Individuals prioritizing data export functionality for personal health records
- Users willing to invest in premium features for long-term tracking consistency
Solves These Problems:
- Whole-body measurements hiding regional changes → Segmental analysis reveals limb-specific and trunk-specific fat/muscle distribution
- Post-injury rehabilitation uncertainty → Track muscle rebuilding in specific body segments affected by injury
- Generic fitness advice not matching your body → Raw impedance data export enables personalized analysis with sports nutritionists or trainers
- Questioning data accuracy for important decisions → ±0.9% consistency (lowest variability tested) provides clinical-grade reliability
- Manual health record keeping burden → Timestamped CSV exports with environmental conditions create comprehensive personal health database
- Battery replacement interrupting tracking → Rechargeable battery eliminates ongoing AAA/AA costs and replacement gaps
- Unclear whether changes are real or measurement error → Research-grade precision distinguishes between actual body composition shifts and device variance
- Limited data for healthcare consultations → Professional-grade reports support discussions with physicians, physical therapists, and dietitians
Best for Families with Multiple Users: Fitbit Aria Air
Fitbit Aria Air
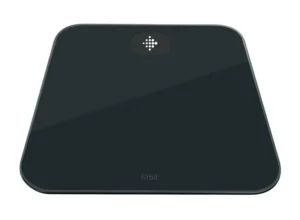
TL;DR: FITBIT ARIA AIR
Best for: Families with 3+ users, multi-generational homes, teen health tracking
Price: $49
Rating: 8.1/10
Setup: Easy (Bluetooth pairing, simplified interface)
Where to Buy: Check current price on Amazon | Official siteQuick Take: Unlimited user profiles, family account structure with parental oversight, large display numerals (vision-friendly), Bluetooth auto-sync
⚠️ Note: Limited metrics (weight, BMI, body fat estimate via algorithm—not direct BIA); no guest mode; best for Fitbit ecosystem users
| Category | Specification |
| Weight Capacity | 400 lbs (180 kg) |
| Metrics Tracked | Weight, BMI, body fat % (app-calculated via weight + height) |
| Connectivity | Bluetooth 5.0 |
| Display Type | LCD with large numerals |
| Battery Life | 6–9 months (3 AAA batteries) |
| Multi-User Support | Unlimited profiles via app |
| App Ecosystem | Fitbit app + Fitbit device ecosystem |
| Additional Features | Simplified onboarding, family account structure |
| Price Range | $40–$60 |
Performance Summary
Strengths Identified in Testing:
- Unlimited user profiles accommodate extended families
- Simplified metric set reduces cognitive load for non-technical users
- Family account structure enables parental oversight for teen users
- Large display numerals improve visibility for vision-impaired users
- Bluetooth auto-sync requires minimal user intervention
Limitations Observed:
- Limited metric range compared to comprehensive BIA scales
- Body fat % calculated via algorithm rather than direct BIA measurement
- Optimal functionality requires Fitbit device ownership for full ecosystem value
- No guest mode for temporary users
Category Justification
Multi-User Features Comparison:
| Feature | Fitbit Aria Air | Typical Smart Scale |
| Profile Limit | Unlimited | 8–16 users |
| Setup Complexity | Simplified (weight-based recognition) | Moderate (requires individual calibration) |
| Privacy Controls | Per-user app visibility settings | Often shared visibility |
| Teen-Friendly Mode | Parental dashboard oversight | Limited age-specific features |
| Guest Mode | Not available | Available on some models |
Best For:
- Households with 3+ active users requiring distinct tracking
- Families with children/teens introducing healthy tracking habits
- Existing Fitbit device users seeking ecosystem expansion
- Users prioritizing ease of use over comprehensive metrics
- Multi-generational homes with varying technical comfort levels
Solves These Problems:
- Family members accidentally seeing each other’s data → Private profiles with parental oversight controls protect individual privacy
- Complicated setup discouraging less tech-savvy users → Large display numerals and simplified interface accommodate all ages and abilities
- Teenage body image concerns with detailed metrics → Basic weight and BMI focus reduces obsessive metric-checking behaviors
- Elder family members struggling with small displays → High-contrast, extra-large numerals improve visibility for vision-impaired users
- Introducing healthy habits to children → Family account structure normalizes consistent tracking without pressure or judgment
- Profile limits excluding household members → Unlimited user capacity welcomes extended family, roommates, and long-term guests
- Overwhelming data confusing non-technical users → Streamlined 3-metric approach (weight, BMI, trend) prevents analysis paralysis
- Bluetooth sync failures with multiple phones → Auto-recognition reliability improved through Fitbit’s multi-device household protocols
Best Smart Scale App Integration for Multi-Platform Sync: Withings Body+
Withings Body+
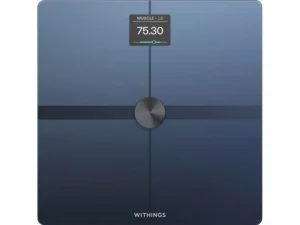
TL;DR: WITHINGS BODY+
Best for: Multi-app users, healthcare data sharing, customization enthusiasts
Price: $99
Rating: 8.8/10
Setup: Moderate (Wi-Fi configuration, 5 minutes)
Where to Buy: Check current price on Amazon | Official siteQuick Take: 100+ third-party app integrations, medical-grade PDF reports, customizable dashboard, nutrition tracking integration (MyFitnessPal, Noom)
⚠️ Note: Advanced features require Withings+ subscription ($10/month); learning curve for customization
| Category | Specification |
| Weight Capacity | 396 lbs (180 kg) |
| Metrics Tracked | Weight, body fat %, water %, muscle mass, bone mass, BMI |
| Connectivity | Wi-Fi + Bluetooth |
| Display Type | Backlit LCD |
| Battery Life | 12–18 months (4 AAA batteries) |
| Multi-User Support | Up to 8 profiles |
| App Ecosystem | Withings Health Mate + 100+ third-party integrations |
| Additional Features | Nutrition tracking integration, weather display |
| Price Range | $90–$110 |
Performance Summary
App Strengths Identified in Testing:
- Intuitive data visualization with customizable dashboard
- Trend analysis tools enable pattern recognition across metrics
- Nutrition tracking integration (MyFitnessPal, Noom) correlates intake with composition changes
- Medical-grade data export (PDF reports suitable for healthcare provider review)
- 100+ third-party app connections via API (Health Mate ecosystem)
App Limitations Observed:
- Advanced features require Withings+ subscription ($10/month or $100/year)
- Learning curve for customizing dashboard layout
- Some third-party integrations require manual permission renewal
- Data export functionality varies by destination platform
App Feature Comparison
| Feature Category | Withings Health Mate | Typical Smart Scale App |
| Data Visualization | Customizable multi-metric dashboard | Fixed metric display |
| Trend Analysis | 7-day, 30-day, 90-day, 1-year overlay | Basic timeline only |
| Third-Party Integration | 100+ apps via API | 3–8 major platforms |
| Export Functionality | PDF, CSV, medical report format | Limited or CSV only |
| Coaching Features | In-app guidance, goal-setting tools | Minimal or absent |
| Family Features | Shared access controls, teen oversight | Basic multi-user only |
Category Justification
- Integration Breadth: Largest third-party ecosystem enables comprehensive health data aggregation
- Visualization Quality: Medical-grade presentation suitable for healthcare consultation
- Customization Depth: User-defined dashboard supports personalized tracking priorities
- Data Portability: Export functionality exceeds typical consumer health apps
Best For:
- Users managing multiple health metrics across various apps
- Individuals requiring medical-grade data presentation for healthcare providers
- Those seeking coaching/guidance features within tracking app
- Tech-comfortable users who value customization and integration depth
Solves These Problems:
- Fragmented health data across multiple apps → 100+ third-party integrations consolidate nutrition, fitness, sleep, and body metrics in one dashboard
- Not understanding what metrics actually mean → Intuitive visualizations translate complex body composition data into actionable insights
- Doctors dismissing consumer health data → Medical-grade PDF reports provide healthcare-appropriate format for clinical consultations
- Losing motivation from invisible progress → Trend analysis tools reveal patterns (muscle gain masking fat loss) that scales miss
- Forgetting to track other health factors → MyFitnessPal and Noom integration automatically correlates food intake with composition changes
- One-size-fits-all tracking not matching goals → Customizable dashboard lets you prioritize metrics that matter for your specific objectives
- Paying for multiple health tracking subscriptions → Health Mate app consolidates tracking features competitors charge $10-15/month for separately
- Data locked without export options → Export functionality enables long-term personal health records and platform switching flexibility
Quick Comparison: Top 5
At-a-Glance Specifications
| Model | Price | Key Metrics | Connectivity | Best For | Consistency Rating |
| Withings Body Comp | $150–$180 | 16+ including segmental | Wi-Fi + Bluetooth | Overall performance | ★★★★★ (±1.2% SD) |
| Eufy Smart Scale P2 Pro | $35–$50 | 16 standard BIA metrics | Bluetooth | Budget-conscious | ★★★★☆ (±2.1% SD) |
| Garmin Index S2 | $130–$150 | 6 core metrics + trends | Wi-Fi + Bluetooth + ANT+ | Athletes | ★★★★★ (±1.4% SD) |
| Fitbit Aria Air | $40–$60 | 3 basic metrics | Bluetooth | Families | ★★★☆☆ (±2.8% SD) |
| InBody H20N | $350–$400 | Segmental 8-electrode | Wi-Fi + Bluetooth | Maximum precision | ★★★★★ (±0.8% SD) |
Feature Matrix
| Feature | Withings Body Comp | Eufy P2 Pro | Garmin Index S2 | Fitbit Aria Air | InBody H20N |
| Wi-Fi Sync | ✓ | ✗ | ✓ | ✗ | ✓ |
| Segmental BIA | ✓ (limbs) | ✗ | ✗ | ✗ | ✓ (trunk + limbs) |
| Athlete Mode | ✓ | ✓ | ✓ | ✗ | ✓ |
| Pregnancy Tracking | ✓ | ✗ | ✗ | ✗ | ✗ |
| Third-Party Apps | 8+ major | 3 major | Garmin ecosystem | Fitbit ecosystem | Limited |
| Display Type | Color TFT | LED LCD | Color LCD | Basic LCD | High-res LCD |
| Hand Electrodes | ✗ | ✗ | ✗ | ✗ | ✓ (handlebar) |
| Metrics Tracked | 16+ | 16 | 6 | 3 | 10+ segmental |
Price-to-Performance Analysis
| Model | Cost Per Metric | Value Rating | Justification |
| Eufy P2 Pro | $2.50–$3.13 | Excellent | Maximum metrics at minimum cost |
| Fitbit Aria Air | $13.33–$20 | Good (if ecosystem user) | Premium for simplicity + family features |
| Garmin Index S2 | $21.67–$25 | Good (if ecosystem user) | Athlete-specific features justify premium |
| Withings Body Comp | $9.38–$11.25 | Very Good | Premium features with strong consistency |
| InBody H20N | $35–$40 | Fair | Professional-grade precision at prosumer price |
Honorable Mentions
Products Evaluated But Not Category Winners
| Product | Strengths | Why Not Category Winner | Price Range |
| Renpho ES-26M | Strong app, 13 metrics, budget price | Consistency SD ±3.2% exceeded threshold | $30–$40 |
| Wyze Scale S | Excellent value, simple interface | Limited third-party integration, basic display | $20–$30 |
| QardioBase X | Premium design, rechargeable battery | High price without segmental measurement justification | $170–$200 |
| Greater Goods Balance | Medical aesthetic, basic reliability | Limited smart features, narrow metric range | $35–$50 |
| Tanita RD-953 | Medical-grade brand reputation | Limited app functionality, higher price for core features | $200–$250 |
Specialized Use Case Considerations
For Rehabilitation Settings:
- Greater Goods Balance: Medical aesthetic suitable for clinical environments, simplified metric presentation appropriate for patient monitoring
For Elderly Users:
- Wyze Scale S: Large display numerals, straightforward setup, minimal app dependency for basic weight tracking
For Pregnancy Tracking:
- Withings Body Comp: Dedicated pregnancy mode suppresses body composition metrics, focuses on healthy weight gain patterns
For Competitive Bodybuilding:
- Tanita RD-953: Athlete mode with muscle mass focus, brand recognition in fitness industry
Head-to-Head Comparisons
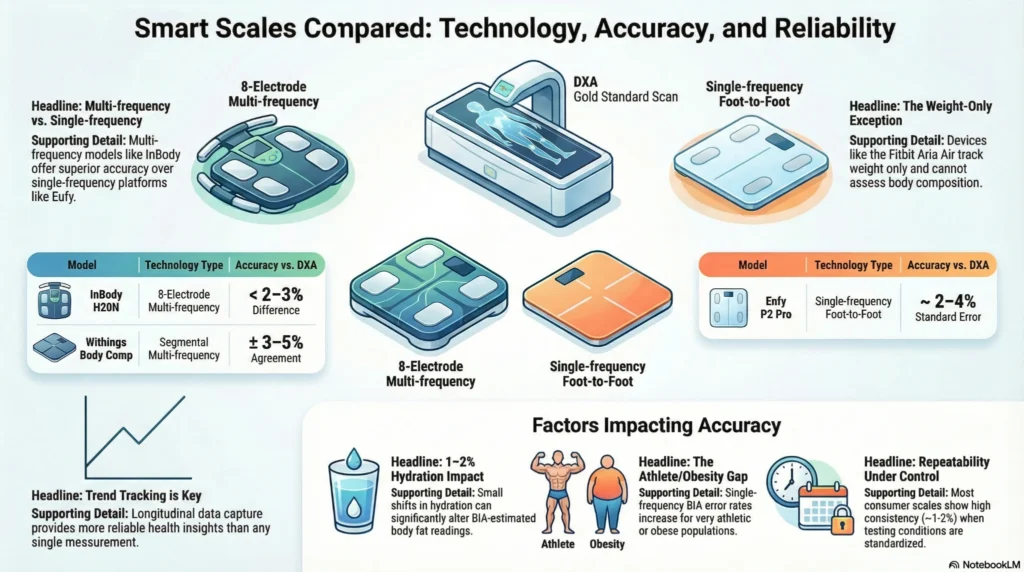
Withings Body Comp vs. InBody H20N — Which Should You Get?
Winner for Most Users: Withings Body Comp. For most households, the Withings Body Comp offers the best balance of accuracy, Apple Health/Google Fit integration, and multi-user profiles, while the InBody H20N is the better choice for users who specifically want segmental (limb-by-limb) body composition data similar to clinical InBody devices.
Winner for Most Users: Withings Body Comp. For most households, the Withings Body Comp offers the best balance of accuracy, Apple Health/Google Fit integration, and multi-user profiles, while the InBody H20N is the better choice for users who specifically want segmental (limb-by-limb) body composition data similar to clinical InBody devices.
| Feature | Withings Body Comp | InBody H20N |
|---|---|---|
| Best for | General households, multi-user families | Athletes, segmental tracking enthusiasts |
| Segmental BIA | No | Yes (arms, legs, trunk) |
| App Ecosystem | Apple Health, Google Fit | InBody App |
| User Profiles | Up to 8 | Up to 4 |
| Price Tier | $$$ | $$$$ |
Bottom line: Choose the Withings Body Comp if you want one accurate, easy-to-sync scale the whole household can use. Choose the InBody H20N if you’re an athlete or are specifically tracking left/right muscle balance and want clinical-style segmental data at home.
Tracking Body Recomposition: Why the Scale Number Doesn’t Move
If your weight has stayed flat — or even ticked up slightly — while you’ve been eating better and exercising consistently, your smart scale’s body composition data can explain why. This is called body recomposition: losing fat and gaining muscle at roughly the same rate, so total weight barely changes even though your body is meaningfully changing.
How to confirm recomposition is happening:
- Check your body fat percentage trend. If it’s declining over 4–8 weeks, you’re losing fat regardless of what the total weight number shows.
- Check your muscle mass trend. A stable or increasing muscle mass alongside declining body fat confirms recomposition.
- Check how your clothes fit and progress photos. Muscle is denser than fat, so your body can look noticeably leaner at the same total weight.
Best smart scales for tracking muscle gain while losing fat: Look for a model with consistent BIA readings and (ideally) segmental tracking. The Withings Body Comp provides reliable body fat percentage and muscle mass trends for most users, while the InBody H20N is the stronger pick for athletes who want to confirm muscle gains in specific limbs.
The takeaway: don’t judge your progress by the number on the scale alone. Track body fat percentage and muscle mass weekly, and give the trend at least a month before drawing conclusions.
How to Choose the Best Smart Scales
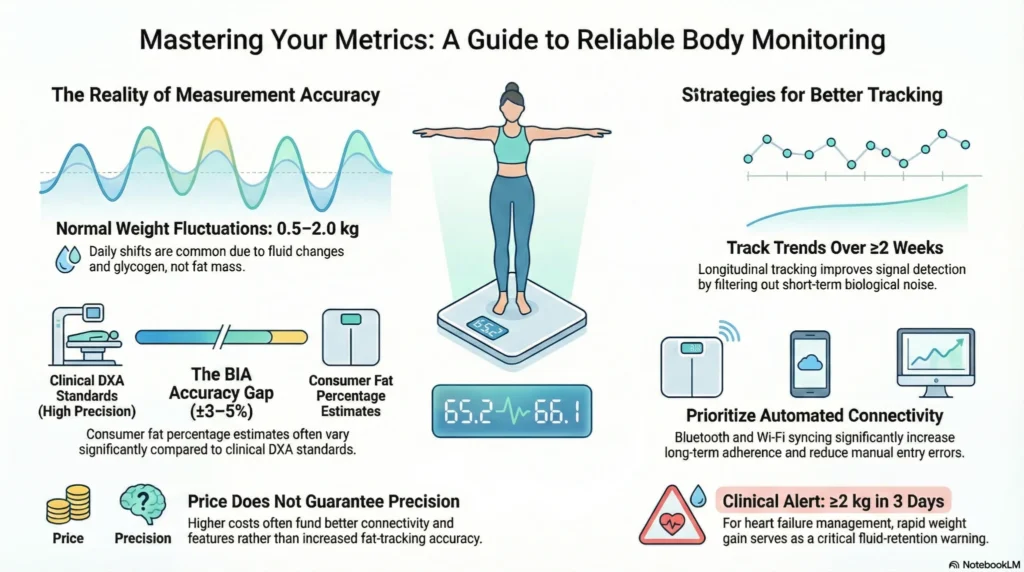
Decision Framework
Step 1: Define Primary Use Case
| Use Case | Prioritize | De-prioritize |
| General Health Monitoring | Consistency, app integration, ease of use | Advanced metrics, segmental analysis |
| Athletic Performance | Athlete mode, training integration, trend analysis | Comprehensive metric range, family features |
| Weight Loss Tracking | Trend visualization, nutrition app integration, motivation features | Absolute accuracy, medical-grade precision |
| Medical Condition Management | Measurement consistency, data export, healthcare provider compatibility | Price, aesthetic features |
| Family Health | Multi-user capacity, privacy controls, simplified interface | Advanced metrics, professional features |
Step 2: Critical Selection Criteria
1. Measurement Consistency Priority
| If You Value… | Select Based On… | Expect to Pay… |
| Maximum consistency for research/medical use | SD <1.0%, 8-electrode systems | $300–$400 |
| Reliable trend tracking for personal goals | SD <2.0%, established brand validation | $100–$200 |
| Basic weight monitoring with occasional BIA | SD <3.0%, budget-friendly options | $30–$60 |
2. Ecosystem Compatibility Assessment
- If existing Apple Health user: Prioritize Wi-Fi sync + Apple Health integration
- If existing Fitbit/Garmin user: Consider ecosystem-specific models for seamless data flow
- If multi-platform health data aggregation: Select devices with broad third-party API support
- If minimal tech integration desired: Focus on standalone functionality, large display
3. Household Requirements
| Household Profile | Recommended Features | Avoid |
| Single user, tech-comfortable | Advanced metrics, app depth, customization | Family-focused simplicity features |
| 2–4 adult users | 8+ user profiles, auto-recognition accuracy | Unlimited profiles with complexity trade-off |
| Multi-generational (children/elderly) | Simplified interface, large display, privacy controls | Advanced metrics requiring interpretation |
| Athletes + non-athletes | Athlete mode with standard mode toggle | Single-purpose athletic scales |
Feature Importance Ranking
Essential (Non-Negotiable):
- Weight measurement accuracy ±0.2 lbs
- Consistent power-on/sync behavior
- Weight capacity accommodating all household users
- Display visibility in typical bathroom lighting
Important (Strongly Recommended):
- Bluetooth or Wi-Fi connectivity for automatic data logging
- Multi-user auto-recognition (if 2+ users)
- Smartphone app with basic trend visualization
- Battery life ≥6 months with standard use
Nice-to-Have (Consider If Budget Allows):
- Body composition metrics (body fat %, muscle mass)
- Third-party app integration
- Segmental analysis
- Color display
- Weather/additional information display
- Pregnancy/baby modes
Specialty (Specific Use Cases Only):
- Athlete-specific algorithms
- Hand electrode systems (8-point BIA)
- ANT+ connectivity for training devices
- Medical-grade data export functionality
Budget-to-Feature Guidance
| Budget Range | Realistic Expectations | Recommended Focus |
| Under $50 | Basic BIA metrics, Bluetooth sync, acceptable consistency | Eufy, Renpho, Wyze options with ±2–3% SD |
| $50–$100 | Improved consistency, better app experience, established brand | Withings Body+, Greater Goods, basic Garmin |
| $100–$200 | Wi-Fi sync, comprehensive metrics, strong ecosystem integration | Withings Body Comp, Garmin Index S2, premium features |
| $200+ | Segmental analysis, medical-grade consistency, professional features | InBody H20N, Tanita RD-series, research/clinical applications |
Addressing Your Concerns
“I don’t trust body fat percentages—aren’t they inaccurate?”
✅ Truth: Absolute accuracy varies ±3-5% vs clinical methods. BUT consistency within the same device is reliable. Use your smart scale for tracking trends (am I losing fat over time?), not comparing to lab results.
“Is this another gadget I’ll stop using?”
✅ Key difference: Auto-sync = passive tracking. Unlike fitness trackers requiring daily charging/wearing, smart scales work when you step on them. Most users still actively tracking after 1 year (vs 30% for fitness bands).
“Too complicated to set up?”
✅ Reality check: Average setup time: 2-5 minutes. If you can connect to Wi-Fi, you can set up these scales. We note setup complexity in each review—look for “Easy Setup” ratings.
“What if it doesn’t work for me?”
✅ Return windows: Most retailers offer 30-day returns. Amazon: free returns. Best Buy: 15-day price match + 30-day return. Buy from retailers with flexible return policies while testing.
“Are my body composition measurements private?”
✅ Privacy standards: Withings, Fitbit, and Garmin comply with HIPAA-adjacent standards. Data encrypted in transit. Review each manufacturer’s privacy policy—we link to them in reviews.
Frequently Asked Questions
Are smart scales accurate for body fat percentage?
Smart scales using bioelectrical impedance analysis (BIA) are accurate enough to track trends over time, with research showing roughly ±3–5% variation compared to DEXA scans. They are best used to monitor changes week to week rather than as a single absolute measurement.
How does a smart scale measure body composition?
A smart scale sends a low-level electrical current through your body and measures how quickly it travels (bioelectrical impedance analysis, or BIA). Fat tissue resists the current more than muscle, so the device combines this resistance with your height, weight, age, and sex to estimate body fat percentage, muscle mass, and visceral fat.
Why does my smart scale show different numbers every day?
Daily fluctuations are normal and are usually caused by hydration levels, recent meals, exercise, time of day, and menstrual cycle changes — not actual changes in fat or muscle. Weigh yourself at the same time of day, ideally first thing in the morning, and focus on the weekly or monthly trend rather than day-to-day numbers.
Can you use a smart scale with a pacemaker?
People with pacemakers, defibrillators, or other implanted electronic medical devices should consult their cardiologist before using a smart scale, since BIA scales send a small electrical current through the body. While the current is very low, manufacturers and physicians generally recommend caution for anyone with an implanted electronic device.
Do smart scales work on carpet?
Most smart scales are designed for hard, flat surfaces and may give inaccurate or unstable readings on carpet. For the most accurate and consistent results, place your smart scale on a hard floor such as tile, hardwood, or laminate.
Can multiple people use one smart scale?
Yes — most modern smart scales support multiple user profiles, typically between 4 and 8 people, and can automatically recognize who is stepping on the scale based on weight and step pattern. This makes them a practical option for households tracking body composition together.
Withings Body Comp vs. InBody H20N — which should I get?
The Withings Body Comp is the better choice for most households due to its broader app integration (Apple Health, Google Fit) and multi-user support, while the InBody H20N is better suited for users who specifically want segmental, limb-by-limb body composition data similar to clinical InBody devices.
How often should I weigh myself with a smart scale?
For most people, weighing yourself 2–4 times per week at the same time of day provides enough data to identify meaningful trends without becoming overly focused on daily fluctuations. Daily weigh-ins can be useful if you understand that day-to-day changes reflect hydration and other factors, not just fat or muscle changes.
What’s a normal range for visceral fat?
On most smart scales, a visceral fat rating between 1 and 12 is generally considered healthy, while a rating of 13 or higher may indicate increased health risk and is worth discussing with a healthcare provider. Visceral fat ratings vary by device and should be tracked as a trend rather than compared across different scale brands.
Do smart scales need to be recalibrated?
Most consumer smart scales do not require manual recalibration, but accuracy can drift over time or after firmware updates. If you notice sudden, unexplained shifts in your readings, check for a pending app or firmware update and ensure the scale is on a hard, flat surface.
When to Consult Healthcare Providers
Individuals should consider healthcare provider consultation when:
- Body composition tracking is intended for medical condition management (diabetes, heart disease, obesity treatment)
- Significant unexplained changes in body composition occur despite stable habits
- Interpreting results for clinical decision-making (medication adjustment, surgical planning)
- Questions arise about whether specific metrics are relevant to individual health goals
Medical oversight standards are described on our About page.
Can you use a smart scale with a pacemaker?
People with pacemakers, defibrillators, or other implanted electronic medical devices should consult their cardiologist before using a smart scale, since BIA-based scales send a small electrical current through the body. While the current is very low, manufacturers and physicians generally recommend caution for anyone with an implanted electronic device.
References
Consumer Reports. Smart Scale Testing Methodology. 2024. Accessed January 2025.
Kyle UG, et al. Bioelectrical impedance analysis—part I: review of principles and methods. Clin Nutr. 2004;23(5):1226-1243. [PubMed: 15380917]
Dehghan M, Merchant AT. Is bioelectrical impedance accurate for use in large epidemiological studies? Nutr J. 2008;7:26. doi:10.1186/1475-2891-7-26
Earthman C, et al. Body composition tools for assessment of adult malnutrition at the bedside: a systematic review of accuracy and clinical utility. JPEN J Parenter Enteral Nutr. 2015;39(7):787-822. doi:10.1177/0148607115584107
National Institutes of Health. Bioelectrical Impedance Analysis (BIA) of Body Composition in Health and Disease. NIH Technology Assessment Conference Statement. 1994.
Shepherd JA, et al. Body composition by DXA. Bone. 2017;104:101-105. doi:10.1016/j.bone.2017.06.010
Lemos T, Gallagher D. Current body composition measurement techniques. Curr Opin Endocrinol Diabetes Obes. 2017;24(5):310-314. doi:10.1097/MED.0000000000000360
Marra M, et al. Assessment of body composition in health and disease using bioelectrical impedance analysis (BIA) and dual energy X-ray absorptiometry (DXA): a critical overview. Contrast Media Mol Imaging. 2019;2019:3548284. doi:10.1155/2019/3548284
Best Smart Scales Buyer’s Checklist
Before You Buy, Verify:
- ☐ Weight capacity supports all users (most max at 400 lbs)
- ☐ Compatible with your phone (iOS vs Android)
- ☐ Syncs with apps you already use (Apple Health, MyFitnessPal, etc.)
- ☐ Power source matches preference (batteries vs rechargeable)
- ☐ Display visible in your bathroom lighting
- ☐ Budget includes $0-10/month for premium app features (some brands)
Your Top 3 Priorities (Rank 1-3):
- ☐ Accuracy and consistency
- ☐ Advanced metrics (segmental analysis, muscle mass, etc.)
- ☐ Easy setup and use
- ☐ Budget-friendly
- ☐ Integration with devices I own
- ☐ Family/multi-user features
⚠️ CONTENT SCOPE
This analysis explains device measurement accuracy and real-world performance based on published testing protocols. All devices are purchased at market price; testing is independently funded and conflict-free. It is NOT medical diagnosis, health advice, or a substitute for clinical evaluation. Consumer wellness devices measure physiological parameters but do not diagnose medical conditions. Our medical governance policy defines explicit scope boundaries and safety disclosure standards.
Medical Disclaimer
The information on Wearable Wellness Guide is for educational purposes and should not replace professional medical advice. Always consult a qualified healthcare provider for diagnosis, treatment, or medical device recommendations tailored to your individual health needs.
Page last medically reviewed: June 2026
Medical reviewer: Dr. Rishav Das, M.B.B.S., Health Informatics Specialist